EMERT Submission history
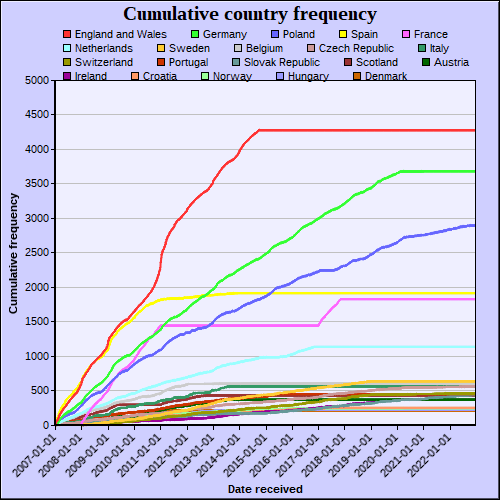
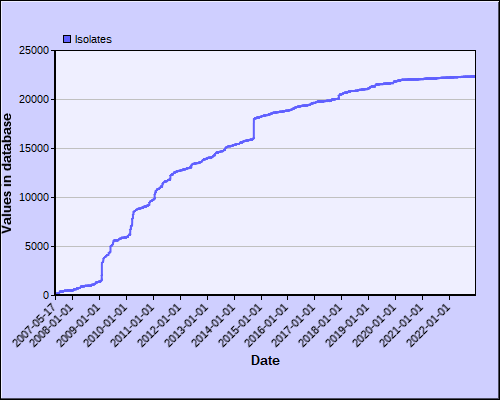
The chart below shows the number of submissions that have been made to the database since it was created. Charts are available for clonal complex, serogroup, PorA and finetype (registered EMERT users only).
Isolates
Countries